


Metabolic Health Research
Lifestyle Health Wrap #19 part 2

If you didn’t read part 1 of this wrap, I recommend it. Check it out here: Foundations of Metabolic Health.
At the end of this post I share more content about Bryan Johnson from
and , and I share my updated take on him. So if your interested in following the Bryan Johnson story, I suggest skipping to the last section first.And without further ado, back to the regular programming…

Sections
Diet | Exercise | Sleep | Stress | Connection | Bryan Johnson Rollercoaster

Diet
Cooking Well with Diabetes: A Healthy Cooking School for Diabetes Prevention and Management | June 14, 2024
N = 1574 adults from 59 predominantly rural Texas counties
Diet Education Intervention
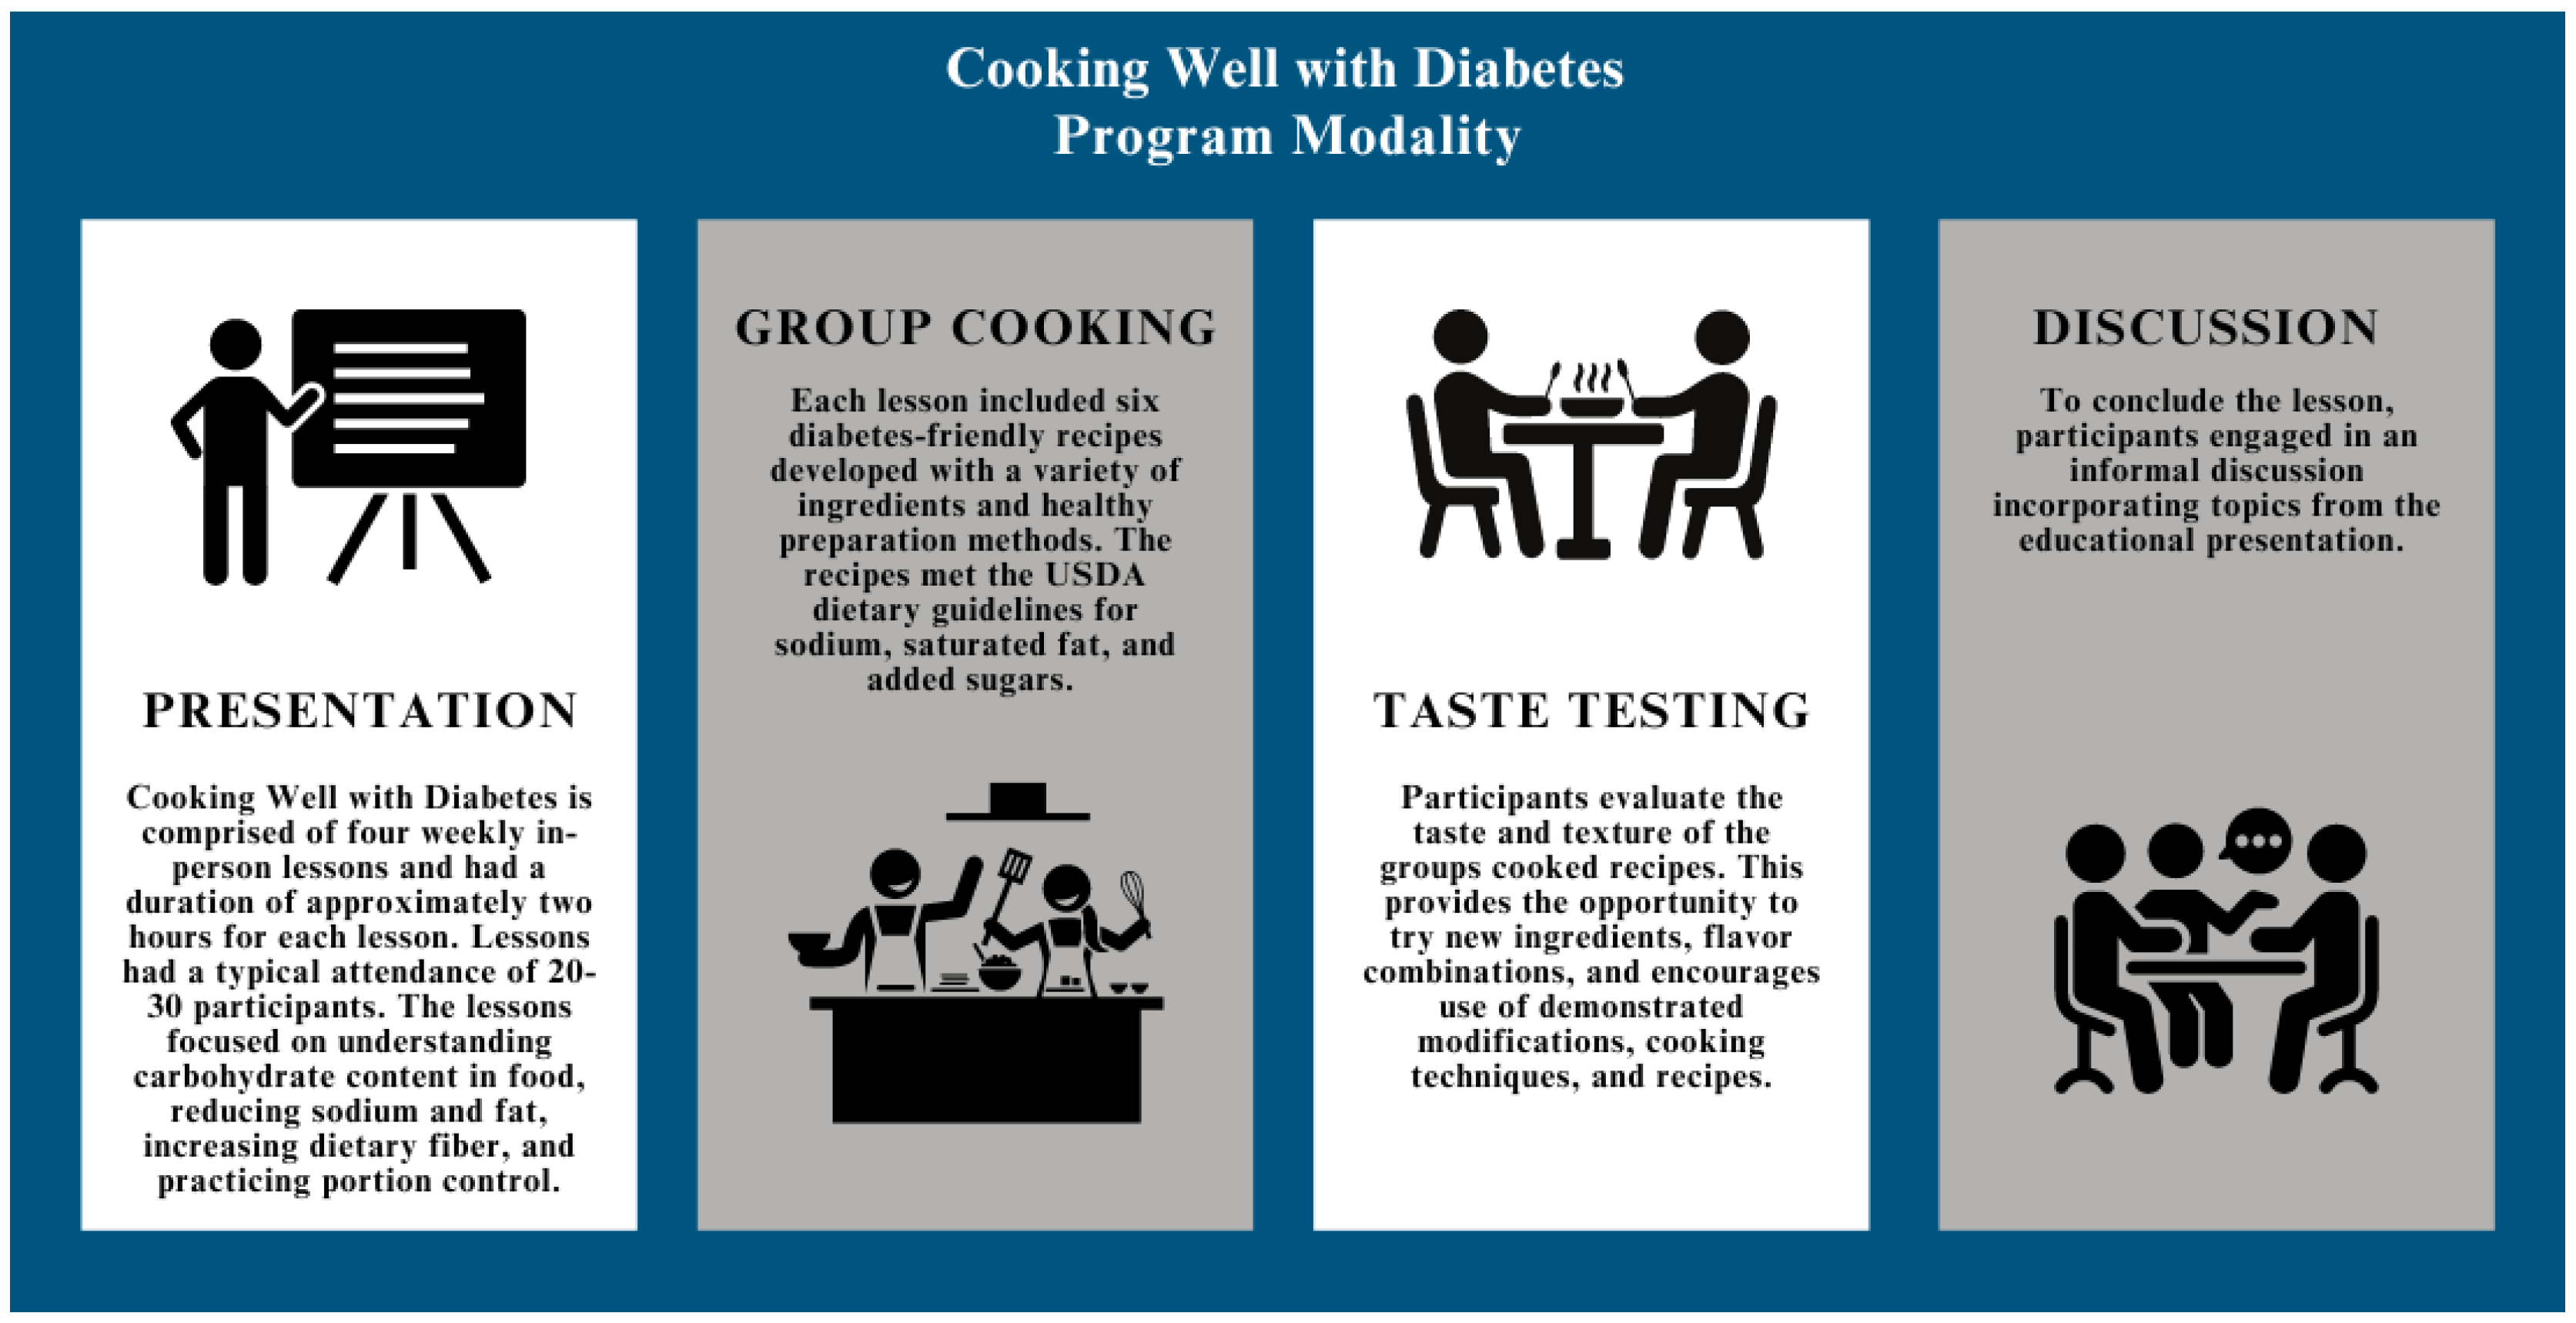
This study covers the a dietary intervention called Cooking Well with Diabetes (CWWD) developed by the Texas A&M AgriLife Extension Service. This is a “four-week interactive diabetes education series, with each week consisting of a lecture on healthy eating coupled with cooking lessons featuring diabetes-friendly recipes.” The goal of this study was to assess the effectiveness of the program “in improving the frequency of healthy food preparation and consumption of program participants.” Details on the program can be found in the Materials and Methods section of the paper.
The scale of this program is quite impressive. Data from 1574 people in this study comes from the implementation of the CWWD program in 59 counties across Texas from 2017 to 2023. The age range of participants was from 18 to 98 years, and although the majority were female (75.9%), the sample was very diverse with 44% identifying as Hispanic, 34.9% as non-Hispanic white, and 14.4% as African American.
Of the total sample, 48% (n = 755) reported having type 2 diabetes, 12.7% (n = 200) had participated in other diabetes cooking schools, 32.8% (n = 517) prepared meals for someone with diabetes, and 85.3% (n = 1342) were the primary person responsible for food shopping in the household.
“Program outcomes were captured using pre and post surveys completed during the first and last educational sessions, respectively.” There were a lot of survey metrics that positively improved after participation in the CWWD program, but I’ll highlight what I think are the most impressive/key metrics. See tables 3 and 4 of the results section for all of the results.
the proportion of participants consuming fruit two or more times a day increased from 34.8% to 49.0% and the proportion consuming vegetables two or more times a day increased from 47% to 62.2%
regular soda and sweetened beverage consumption decreased at a statistically significant level, but only by a few percentage points for each category (see table 3 for details)
Participants who reported always or mostly …
modifying recipes to reduce sugar or fat increased from 32.6% to 43.5%
modifying recipes to increase dietary fiber increased from 21.5% to 33.1%
using healthy cooking methods such as broiling, baking, or grilling instead of frying increased from 55.2% to 72.4%
adding extra vegetables to mixed dishes such as casseroles and soups increased from 15.6% to 32.2%
consulting nutrition facts labels increased from 34.6% to 53.8%
With the rise in the prevalence of metabolic syndrome, obesity, and diabetes in the past several decades, the results of this study are promising and suggests the need for wider implementation of similar programs around the country. I hope these researchers do more follow-up research to see if/how the health of participants who partook in this program has improved in the years since.
Takeaways:
Healthy eating/cooking classes can help improve dietary habits and lead to improved health.
If you want to improve your dietary habits, finding a program like CWWD (which by the way only cost participants $20-$40 total for the entire series) to participate in to kickstart healthy eating habits seems like a good idea.
Exercise
Physical activity in relation to metabolic health and obesity: The Feel4Diabetes study | June 19, 2024
N = 2848 men and women from families at risk of the development of diabetes
Prospective Cohort Study
Study aim: “To examine physical activity levels in association with metabolic health and estimate the stability of metabolically healthy obese (MHO) phenotypes over a 2-year period.”
What does it mean to be metabolically healthy obese?
Tracking the citations made in this paper, I found the study titled "An Empirically Derived Definition of Metabolically Healthy Obesity Based on Risk of Cardiovascular and Total Mortality", which seems to present the most definitive definition of MHO. It defines MHO as being obese (defined as having a body mass index (BMI) of 301 or more) while having “systolic BP [blood pressure] less than 130 mm Hg, no BP-lowering medication, waist-to-hip ratio less than 0.95 for women and less than 1.03 for men, and no self-reported (ie, prevalent) diabetes.” Of the over 385,000 participants whose data was used to derive this definition, being metabolically healthy obese “was not associated with CVD [cardiovascular disease] and total mortality compared with metabolically healthy normal weight.” So essentially, to be metabolically healthy obese is to be obese without having the the same biomarkers that put most obese people at a higher risk of cardiovascular disease and mortality.
As this current study points out, definitions of MHO vary and “there is no universally established definition for the concept of metabolic health in obesity.” Therefore this study chose to apply five different existing definitions “to estimate the presence of the MHO phenotype in a large multiethnic sample of early middle-aged adults.”
Methods: “2848 men and women from families at risk of the development of diabetes were recruited. Participants were classified as obese or non-obese and metabolic health was defined using five existing definitions. Physical activity was estimated with the International Physical Activity Questionnaire and pedometers.” The average age of the cohort was 42 years (±7.4 years) and 65% were females.
Two of the definitions of metabolic health they used are variations of the same the definition that I covered in part 1 of this wrap, which I am now informed first originated in this paper: Metabolic syndrome—a new world-wide definition. A Consensus Statement from the International Diabetes Federation. These were:
‘Metabolic Syndrome Definition’: fulfillment of a maximum of two of the five components of the M.S.
‘Strict Metabolic Syndrome Definition’: no fulfillment of any component of the M.S.
See part 1 of this wrap to refresh your memory on what the five components of metabolic health are. Two of the definitions are variations in a threshold for categorizing people as insulin resistant based on their homeostasis model assessment for insulin resistance (HOMA-IR) score, which is a value calculated based on fasting insulin and glucose levels. These were:
‘Low IR-Q3 Definition’: HOMA values equal to or less than the 75th percentile in the specific population.
‘Low IR-Q2 Definition’: HOMA values equal to or less than the 50th percentile in the specific population.
The fifth definition, the most stringent, is a combination of these two different approaches.
‘Zero M.S. Components + Low IR Definition’: no fulfilment of any component of the M.S. plus HOMA values equal to or less than the 50th percentile in the specific population.
The following graph displays the percentage of this sample who were classified as metabolically unhealthy obese (MUO), metabolically health obese (MHO), metabolically unhealthy not obese (MUNO), and metabolically healthy not obese (MHNO) based on these five different definitions for metabolic health and the ≥ 30 BMI threshold for classification as obese. The bars in the graph are listed in the same order as they are presented above.
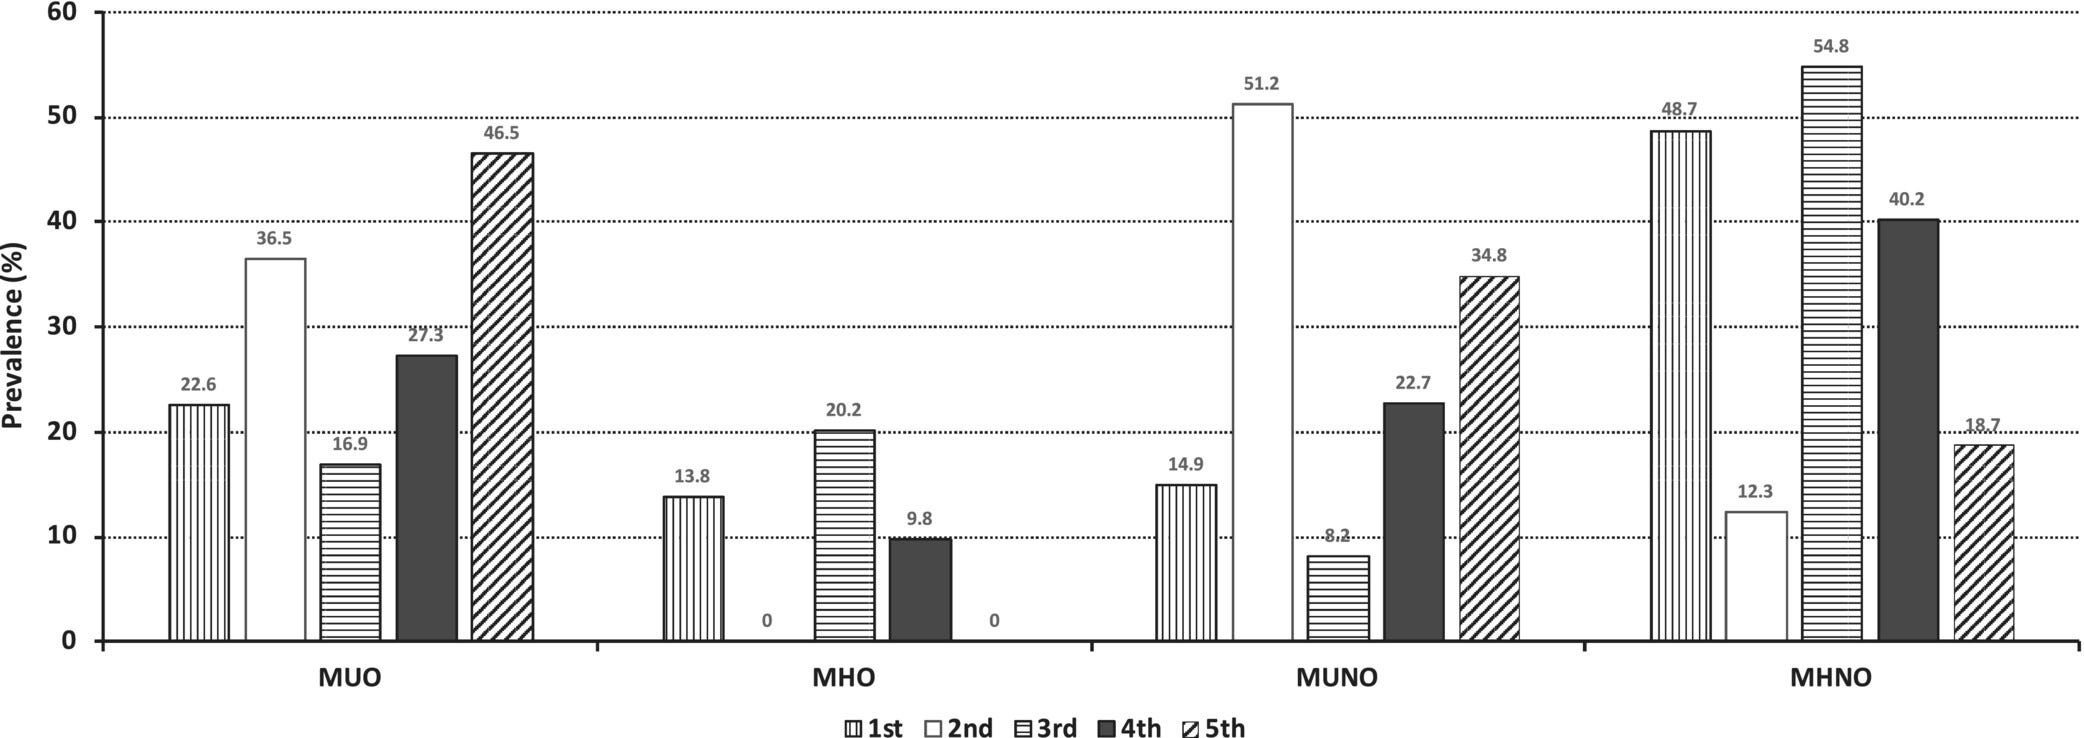
Results: “Prevalence of the MHO phenotype varied among definitions (0% to 20.2%). Overall, the MHO [metabolically health obese] were more active than the metabolically unhealthy obese (MUO). Daily sitting hours (odds ratio [OR] = 1.055, 95% confidence interval [CI]: 1.009-1.104) and daily steps (per 500; OR = 0.934, 95% CI: 0.896-0.973) were remarkable predictors of metabolic health in individuals with obesity; and likewise, in individuals without obesity. After 2 years, 44.1% of baseline MHO [metabolically healthy obese] adults transitioned to [metabolically unhealthy obese] MUO [based on the fourth definition of metabolic health (Low IR-Q2)], while 84.0% of the MUO at baseline remained at the same phenotype. Although physical activity was not a major determinant in phenotype transitioning, daily steps were associated with the maintenance of metabolic health over time in the non-obese group.” Notably: “Increasing daily stepping by 500 steps was associated with 6.6% and 6.5% reductions in the odds of being MUO (OR = 0.934, 95% CI: 0.896-0.973) and MUNO (OR = 0.935, 95% CI: 0.904-0.967), respectively.”
Takeaways:
Being metabolically healthy and obese tends to be a transitional state wherein most people in this group eventually become metabolically unhealthy (44% in 2 years in this study, but presumably a majority with more time and this is seen in the other studies cited in this paper).
Staying active, particularly walking and reducing sedentary time, help maintain metabolic health in both obese and non-obese individuals.
Sleep
Ad libitum Weekend Recovery Sleep Fails to Prevent Metabolic Dysregulation during a Repeating Pattern of Insufficient Sleep and Weekend Recovery Sleep | March 18, 2019
N = 36 healthy, young adults
Randomized Controlled Trial
In this study, healthy young adult participants were randomly assigned to one of three groups:
a control group with the opportunity to sleep 9 hours per night (n = 8)
a sleep restriction group (SR) that had the opportunity to sleep up to 5 hours per night (n = 14)
a sleep restriction with weekend recovery sleep group (WR) (n = 14)
For the first 3 nights, participants could sleep their regular amounts (~8 hours on average for each group) and polysomnography (PSG)2 was used to assess for sleep disorders during night 1 (those participants would be excluded) and to establish baseline sleep metrics during nights 2 and 3. Thereafter, participants had 9 nights of sleeps according to their assigned group. The difference between the sleep restriction (SR) and sleep restriction with weekend recovery (WR) sleep groups is that the SR group had 9 nights in a row of only a 5 hour period for sleep whereas the WR group could sleep as much as they wanted during two days after 4 nights of sleep restriction then had two more nights of sleep restriction thereafter. This was to simulate sleep recovery over a weekend after a workweek of sleep deprivation.
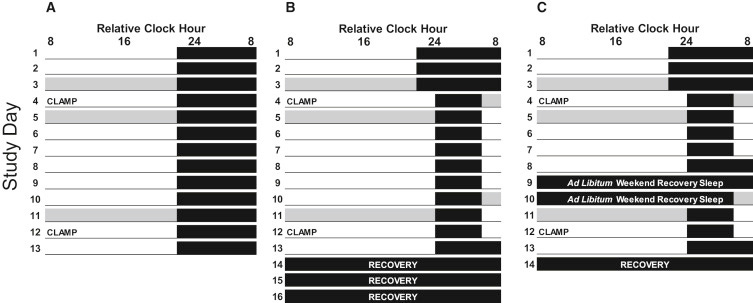
With regard to the diagram above: the groups from left to right are control, sleep restriction (SR), and weekend recovery (WR). CLAMP indicates when insulin sensitivity was measured using a hyperinsulinemic-euglycemic clamp. This is a method whereby insulin and glucose are co-administered to measure insulin sensitivity based on variable glucose uptake during a constant rate of insulin infusion. The higher amount of glucose that can be administered is an indicator of how effective one’s body is at responding to the insulin that is being co-administered. Thus a higher score is indicative of higher insulin sensitivity (a good thing; insulin resistance = not good).
Results: “For SR and WR groups, insufficient sleep increased after-dinner energy intake and body weight versus baseline. … In SR, whole-body insulin sensitivity decreased ∼13% during insufficient sleep versus baseline, and in WR, whole-body, hepatic, and muscle insulin sensitivity decreased ∼9%–27% during recurrent insufficient sleep versus baseline. Furthermore, during the weekend, total sleep duration was lower in women versus men, and energy intake decreased to baseline levels in women but not in men. Our findings suggest that weekend recovery sleep is not an effective strategy to prevent metabolic dysregulation associated with recurrent insufficient sleep.”
This study is limited by the fact that you can only keep people in a lab and tightly control and measure variables of interest for so long. Nonetheless, it does a pretty good job of demonstrating that when it comes to the metabolic effects of sleep deprivation, you cant really make up for it by sleeping more during the weekend.
Takeaway: it’s better for your metabolic health to prioritize a consistent sleep schedule with adequate sleep throughout the week rather than not getting enough sleep during the work week and trying to catch up during the weekend.
Stress
Improvement in symptoms of anxiety and depression in individuals with type 2 diabetes: retrospective analysis of an intensive lifestyle modification program | October 22, 2024
N = 1061 type 2 diabetic or pre-diabetic adults from India (177 pre-diabetic)
Retrospective Cohort Study
“This retrospective study was carried out at the Freedom from Diabetes Clinic, which operates on a one-year subscription-based program for the online management of diabetes.” The program consists of lifestyle modifications that include: a customized plant-based diet, a customized physical activity plan, psychological support through group and individual therapy, and medical management. Interventions were delivered through online group sessions and individual consultations with specialists. “Upon enrollment, each patient was assigned a team of six specialists: physician, dietician, physiotherapist (exercise expert), psychologist, mentor (former program participant who volunteered to guide new patients), and monitor (for follow-ups and reminders for lab tests, appointments, etc.).”
Essentially, these individuals were given a ton of support to improve their overall health, with mental health, particularly symptoms of depression and anxiety (assessed with the PHQ-9 and GAD-7, respectively) being of primary interest to this study, but many other outcomes were also measured.
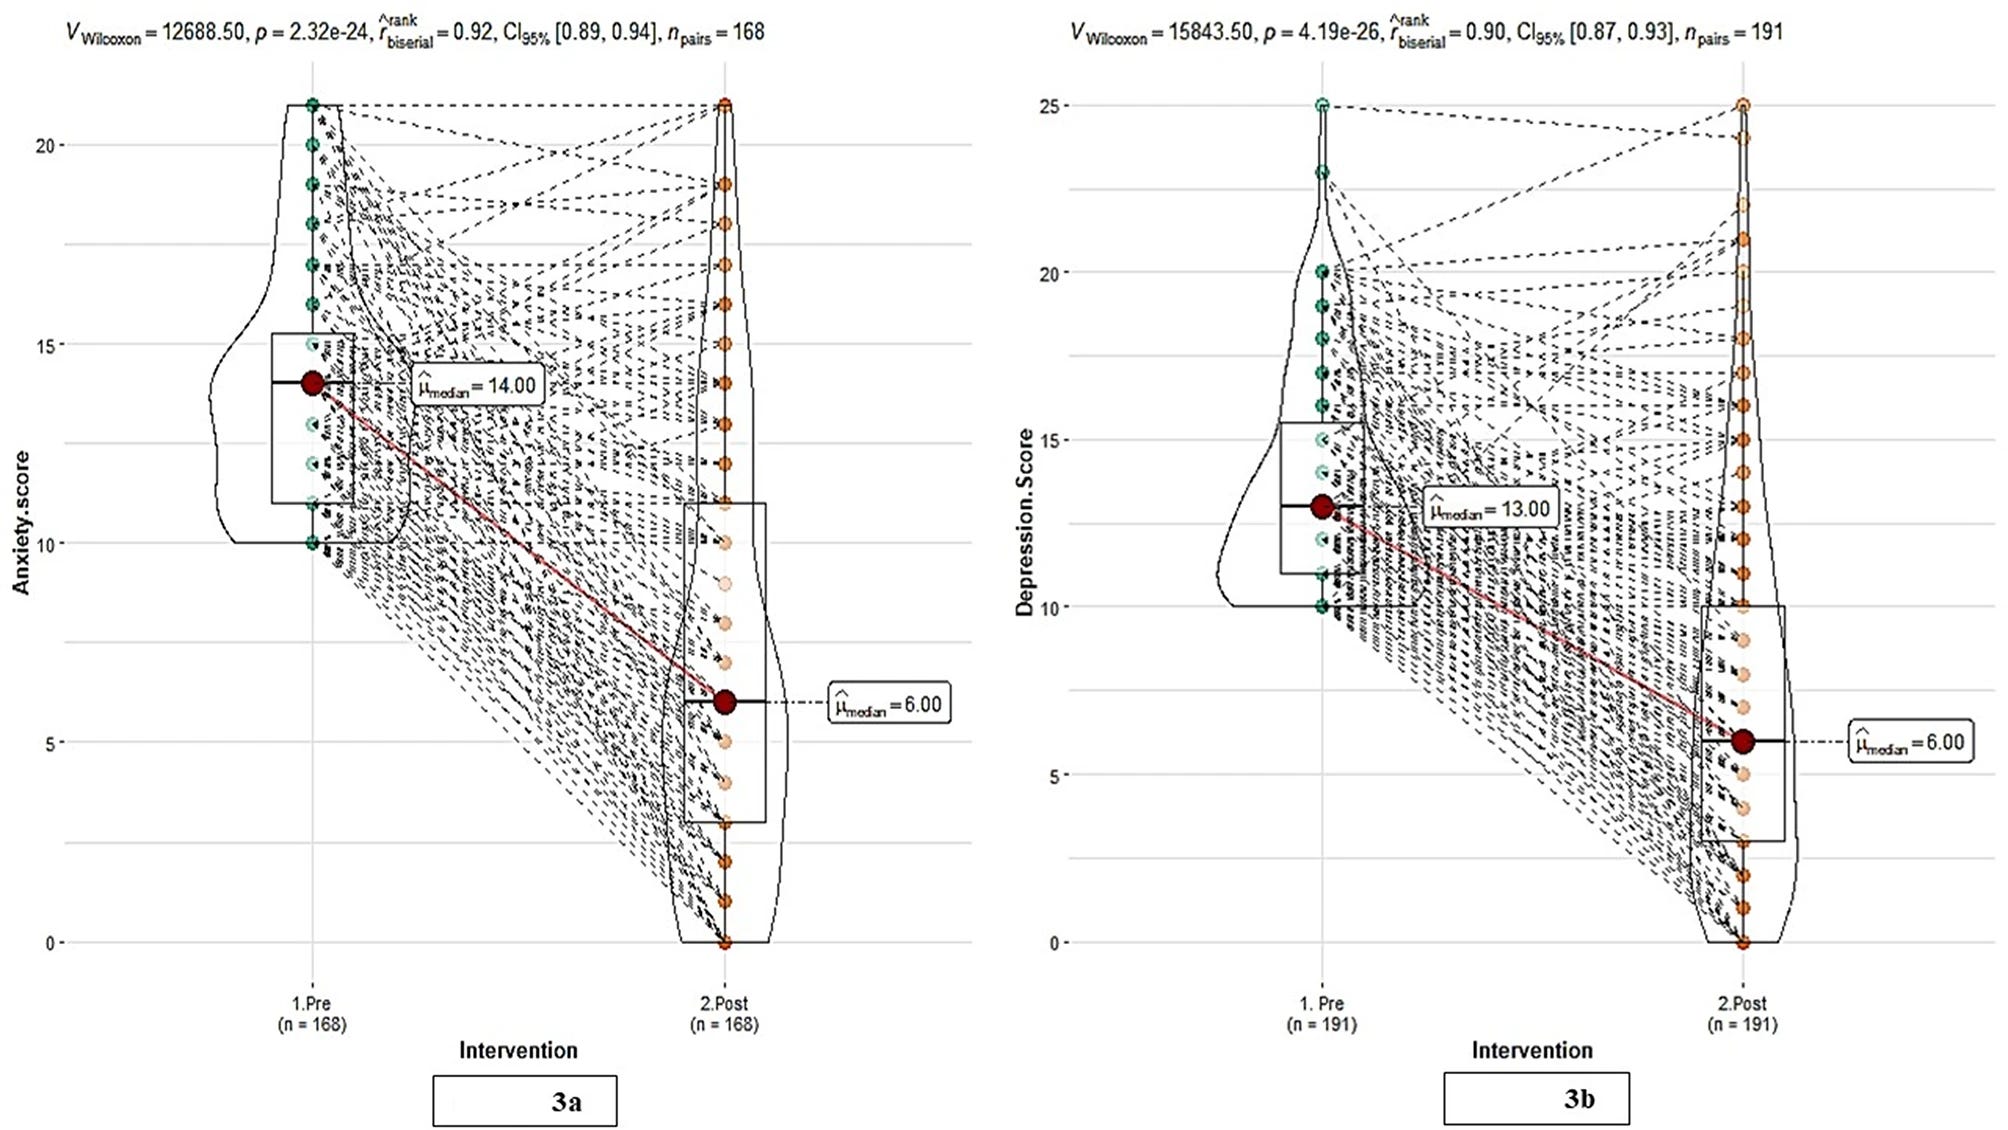
The results were pretty great. There was a statistically significant decrease in depression for each group who had a depression score in the range of mild to severe at baseline. Changes in depression severity were assessed on a group basis, grouping participants based on their baseline scores compared to their post-intervention scores (0-4: none-minimal; 5-9: mild; 10-14: moderate; 15-19: moderately severe; and 20-27: severe). See table 3 for details on these results. Similarly, for each group who had an anxiety score in the range of mild to severe there was a statistically significant decrease in anxiety. These anxiety score analyses were also analyzed on a group-by-group basis (0-4: minimal; 5-9: mild; 10-14: moderate; 15-21: severe). See table 2 for details on these results. Figure 3 provides a nice visual representation of these results (these are called violin plots).
Other key results unrelated to mental health: “Post-intervention, a statistically significant (p < 0.001) decrease in median weight was observed from 71 kg to 66 kg corresponding to an average reduction of 4.71 kg (95% CI: 4.3 to 5.0 kg). Similarly, median HbA1c levels showed a significant improvement (7.5 to 6.5%) (p < 0.001) following the intervention, with an average decrease of 1.28 (95% CI: 1.1 to 1.3).”
This study was impressively complex and involved, but I imagine the fact that it was organized via an app help streamline the logistics. It goes to show how intensive interventions aided by technology can be scaled and that despite requiring significant coordination and up-front costs, they can produce significant benefits to people’s health.
One thing I don’t understand: in the methods and materials section of the abstract it's stated that data were collected “at the start and end of the six-month intervention period.” But in the methods section of the paper, as I quoted above, the intervention is referred to as a “one-year subscription-based program.” So I’m not sure why only a 6-month period was used here if the entire intervention period was 12-months long. It’s worth mentioning though that this seems to be a sub-study/secondary publication. The authors state that “detailed intervention has been previously described” and reference this paper: The Diabetes Remission in India (DiRemI) study: Protocol for a prospective matched-control trial.
Takeaways: taking a comprehensive approach to improving health via improved diet, consistent exercise, and psychological support is likely to lead to reduced anxiety and depression.
Connection
The Role of the Perceived Neighborhood Social Environment on Adolescent Sedentary Behavior and Physical Activity: Findings from Add Health3
February 19, 2024 | N = 6504 adolescents (age 12 to 19) who participated in the National Longitudinal Study of Adolescent Health (Add Health) in the 1994–1995 school year
Retrospective Cohort Study
This study highlights the need to better understand the socio-economic factors that influence sedentary behavior (SB) and physical activity (PA) given the rise of sedentary time and decrease in physical activity that has been observed among adolescents in recent years. Using data from the Add Health survey 1994-1995 cohort, these researchers conducted a cross-sectional analysis to investigate how SB and PA vary based on perceived neighborhood social environment.
This study found that neighborhood safety and contentedness were negatively associated with SB, whereas neighborhood social cohesion and connectedness were positively associated with PA. Gender-specific and race-specific results remained somewhat consistent with overall findings; however, neighborhood safety was not associated with SB among female and non-White adolescents, respectively. Similarly, neighborhood safety and contentedness were not associated with MVPA for non-White adolescents.
From a related paper cited in this study (citation 14), they define perceived neighborhood contentedness as “an overall comfort level that the adolescent has and incorporates their feelings of safety, familiarity, and comfort.” A key limitation of this study is that sedentary behavior and physical activity were not objectively assessed (with a wearable device for example) but measured only through the use of surveys, therefore responses may be biased. Nevertheless, the results of their study align with prior research.4
Takeaway: adolescents’ perceptions about their neighborhoods, particularly how safe they are and how comfortable they are in them, can influence how active they are. Intuitively, this makes sense: would you expect a kid to be outside and active if they don’t feel comfortable/safe in their neighborhood?
The Bryan Johnson Rollercoaster
If you've been following my posts you've seen in real time my perspective on Bryan Johnson develop and it continues to. I send my thanks to
and for their recent investigative and critical commentaries about Bryan.Scott Carney’s report on Bryan Johnson (mostly video): The Bryan Johnson "Hit Piece" Surprising revelations in the New York Times puts Johnson's integrity into question. | Also on YouTube
I am now not simply skeptical about Bryan’s aims but suspicious of his methods. He seems to think he can cut ethical corners too boost his message and his impact. Joseph has been exposing Bryan’s sketchy messaging tactics and dishonesty via a series of YouTube shorts.
Here’s a great one for example (3 minutes): Bryan Johnson: Doublespeak Master
This short by Everett goes to show how Bryan uses marketing doublespeak to boost people's confidence in his message and motivate them to buy his products. I don't even really have a problem with Bryan creating the company Blueprint. A lot of people criticizing him seem to care about the fact that he is making money off of this and are disappointed in that fact in and of itself. I don't really have a problem with it because people can have jobs and get paid well from the development of this business that is striving to improve people’s health. But as we can see in the US healthcare system, there can be corruption in a seemingly honorable business.
I don't want to give Bryan too hard of a time because the real problematic people in the online health and wellness sphere are true grifters selling overt pseudoscience to people who don't know any better, but I can't say he’s distinguishing him very well from them. He should be holding himself to a very high standard if he really wants to be a successful champion of human health and longevity. He’s already has people's attention, if he wants to gain their trust he needs to tamp down his rhetoric and tamp up his humility, honesty, and nuance. It may be at the cost of attention and sales, but he claims that's not the goal afterall. We need to hold our health leaders to the highest of standards. Bryan obscuring details about his health, obscuring details about his products, and conflating the potential those products with the quality of his own health is worthy of criticism insofar as it's borderline marketing fraud. Those like myself who support what he claims to be about—improving the quality of human life—need to call him out and hold him to a higher standard.
As always, please let me know if you have any feedback or notice any errors. Thanks for reading!
Disclaimer: This newsletter provides health information and research for educational purposes only. It is not a substitute for professional medical advice. Consult a healthcare professional for guidance on your health-related decisions. We are not medical professionals.
BMI = Weight (kg) / Height (m)^2 | Calculate Your Body Mass Index
“Polysomnography (PSG) is a multi-parameter type of sleep study[1] and a diagnostic tool in sleep medicine. … The PSG monitors many body functions, including brain activity (EEG), eye movements (EOG), muscle activity or skeletal muscle activation (EMG), and heart rhythm (ECG).” Polysomnography on Wikipedia
Compared to the other articles, this one is a bit of a stretch, but my logic is as follows: sedentary behavior and physical activity affect metabolic health, so if “perceived neighborhood social environment” influences these, then it will have a secondary effect on metabolic health. How we interact with, perceive, and relate to our neighborhood social environment is one way domain in which we are able to connect to something greater than ourselves (which is why it makes sense for this section).
Here’s some related research cited in this paper:
9. Tamura, K. (2019). Neighborhood Social Environment and Cardiovascular Disease Risk. Current Cardiovascular Risk Reports, 13(4): 7.
10. Sallis, J. F., et al. (2012). Role of built environments in physical activity, obesity, and Cardiovascular Disease. Circulation, 125(5), 729–737.
11. Datar, A., Nicosia, N., & Shier, V. (2013). Parent perceptions of Neighborhood Safety and Childrens Physical Activity, Sedentary Behavior, and obesity: Evidence from a National Longitudinal Study. American Journal of Epidemiology, 177(10), 1065–1073.
12. Owen, N., et al. (2000). Environmental determinants of physical activity and sedentary behavior. Exercise and Sport Sciences Reviews, 28(4), 153–158.
13. Kim, J., et al. (2010). The Effect of Perceived and Structural Neighborhood conditions on adolescents’ physical activity and sedentary behaviors. Archives of Pediatrics & Adolescent Medicine, 164(10), 935–942.
14. Bazaco, M. C., et al. (2016). Is there a relationship between Perceived Neighborhood contentedness and physical activity in Young men and women (Vol. 93, pp. 940–952). Journal of Urban Health-Bulletin of the New York Academy of Medicine. 6.
15. Lenhart, C. M., et al. (2017). Perceived neighborhood safety related to physical activity but not recreational screen-based sedentary behavior in adolescents. Bmc Public Health, 17(1), 722.
16. Strong, L. L., et al. (2013). Associations of perceived neighborhood physical and social environments with physical activity and television viewing in African-American men and women. American Journal of Health Promotion : Ajhp, 27(6), 401–409.
27. Salvy, S. J., et al. (2017). The social context moderates the relationship between neighborhood safety and adolescents’ activities. Prev Med Rep, 6, 355–360.
Thanks for the thoughts on Johnson. After I put the video out he declared he is starting a religion. Total madness.