


Ditch Fruit Juice, Me Trying to Explain a Mendelian Randomization Study, and New Thoughts About Bryan Johnson
Lifestyle Health Wrap #18

As I wrote in my post 4 weeks ago: it’s a busy time in my life; so I’ve been doing my best to maintain my own lifestyle health. Recently, I started sharing some posts about my lifestyle and health lessons on the Don’t Die app. It’s only about a 5-week-old small social network community of health geeks that Bryan Johnson started. Anyhow, I have some more thoughts and learnings to share about Bryan as I continue to follow his work and media appearances. See the “Other” section at the bottom for that.
I’ve done two things differently with this wrap. First, a small but notable change that I plan to implement in future wraps as well: instead of listing the full doi.org link for each paper, per usual I’ve simply hyperlinked paper links to their titles. This way, if you’re like me and like to listen to things on the Substack app (I highly recommend this1) you don’t have to listen to the readout of URLs filled with random characters. Second: I spent so much time on the paper for the exercise section, that for the Sleep, Stress, and Connection sections, I’ve opted to just include a few bullet points instead of doing a more comprehensive summary.
I hope you learn something. Enjoy!

Sections
DIET | EXERCISE | SLEEP | STRESS | CONNECTION | OTHER
Diet
Fruit juice: just another sugary drink? | June 2014
Comment
It is well known that sugary drinks like sodas are not good for our health. Sugar-sweetened beverage (SSB) consumption is linked to weight gain, increased risk of diabetes, and increased risk of cardiovascular disease.2 In this short comment piece, two cardiometabolic health researchers highlight the need to shift public perception of fruit juices, with an understanding of their similarity to sugar-sweetened beverages.
They acknowledge that fruit juices are a better alternative to sugary drinks like sodas because they contain vitamins, but they point out that “this micronutrient content might not be sufficient to offset the adverse metabolic consequences of excessive fruit juice consumption.” Importantly, they highlight that the sugar content of juices and sodas tends to be about the same. A cup of apple juice and soda both have about 26 grams of sugar.
There is good reason to believe that regular consumption of fruit juice can increase the risk of diabetes and other metabolic diseases in the same way that regular consumption of SSBs can. The authors highlight that “consumption of 480 ml [2 cups] of high-antioxidant concord grape juice per day for 3 months increased insulin resistance and waist circumference in overweight adults in one randomised controlled trial.”3
Takeaway:
Regularly consuming fruit juice is probably not benefiting your health
Consuming whole fruits is a better way to obtain nutritional benefits from fruits, especially the fiber they contain, which is often absent or very reduced in fruit juices.
Here’s another short essay on this topic from the Heart & Stroke Association of Canada.
Exercise
Effects of physical activity and sedentary time on depression, anxiety and well-being: a bidirectional Mendelian randomisation study | December 18, 2023 | N = 145,982 individuals of European ancestry from the UK Biobank
Mendelian Randomization Study
I recently had to learn about the Mendelian Randomization (MR) study design in my master’s program and may even try to conduct this sort of study. Thus, I selected this study to improve my understanding of MR and see if I could effectively communicate the methodology and conclusions that can be drawn from such a study. This video also helps explain this methodology.
DNA is made up of two long strands of molecules called nucleotides that are held together by hydrogen bonds between matching nitrogenous bases (Adenine (A) is always paired with Thymine (A) and Guanine (G) is always paired with Cytosine(C)). Our DNA is made up of approximately 3 billion base pairs. In genetics research, we refer to a base pair location where variation is common, that is, where it is not uncommon for the specific base pair (AT, TA, GC, or CG) in one person to be different from another person, as a single nucleotide polymorphism, or SNP (pronounced as “snip”) for short.
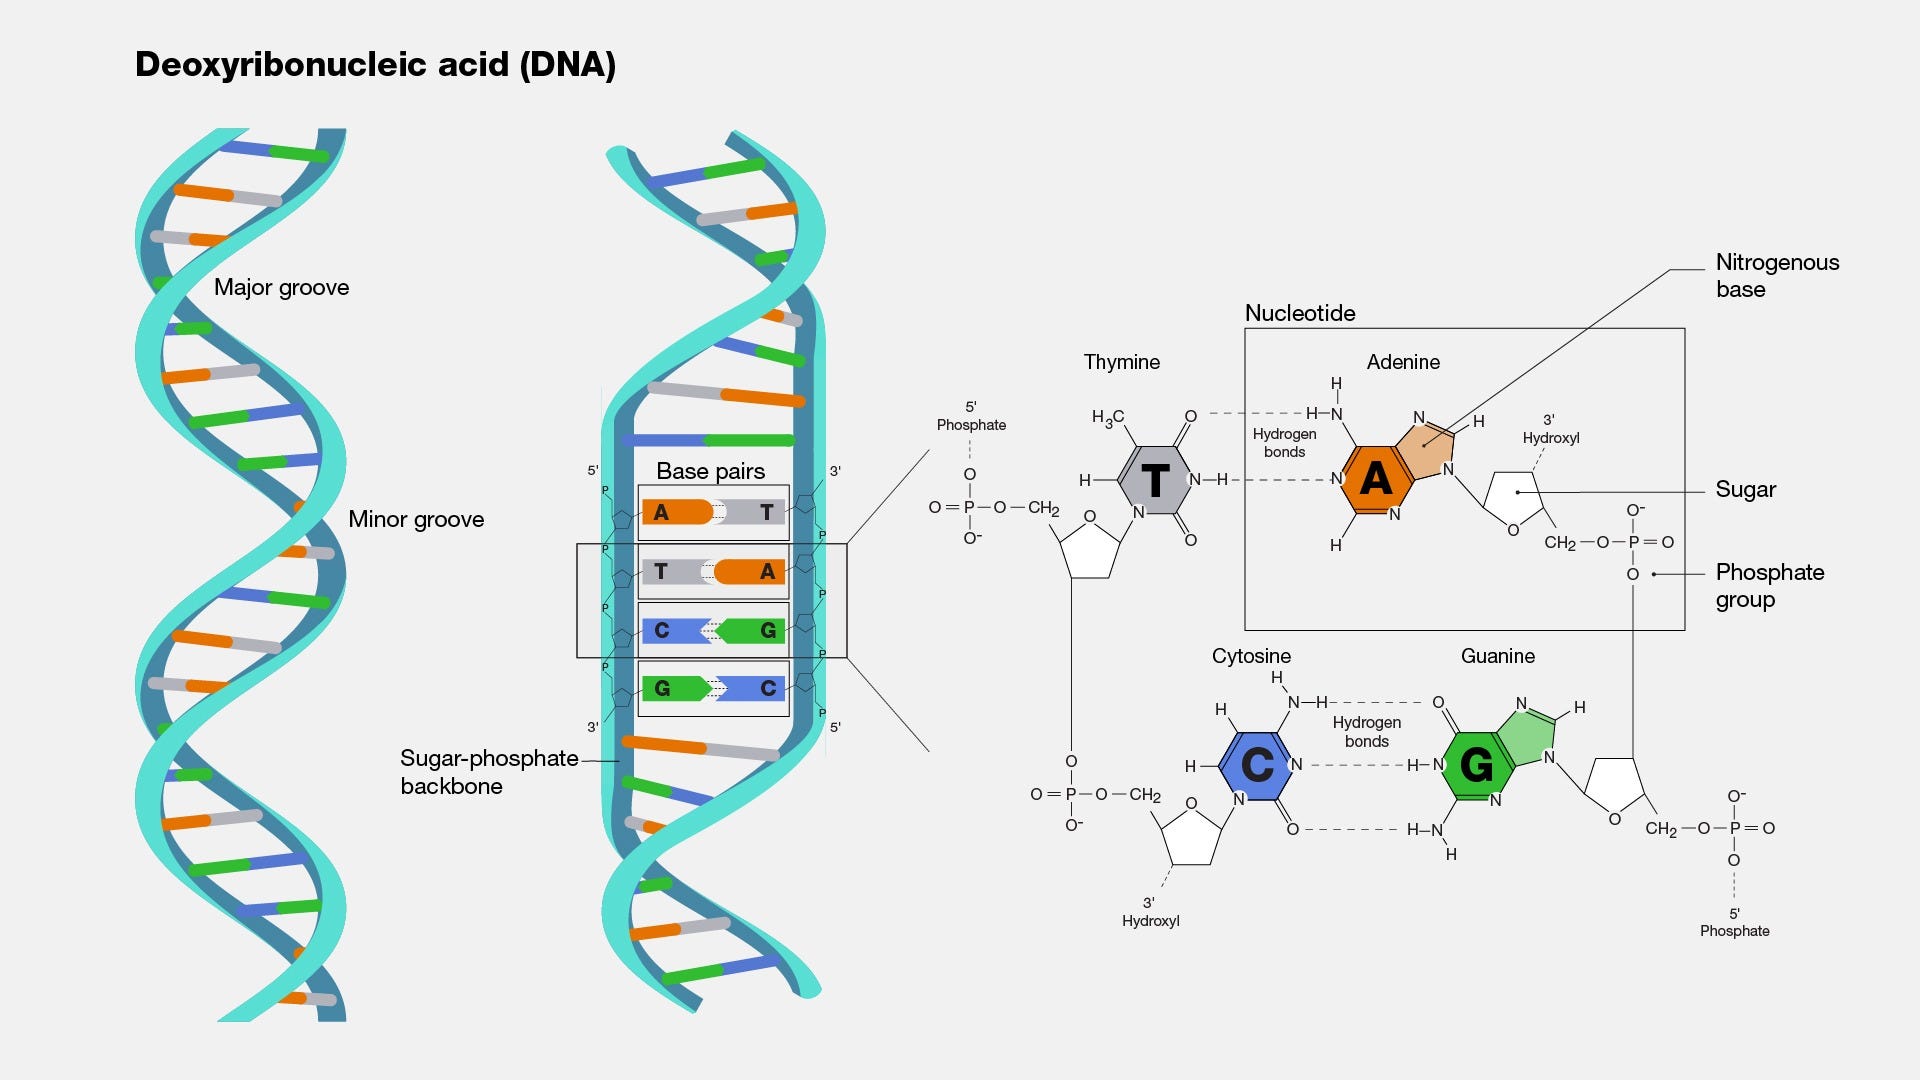
In genetic research, with a sufficiently large sample of genetic information from many participants, SNPs can be identified and associated with particular characteristics. This is often done using genome-wide association studies (GWAS); these are studies that identify SNPs that are associated with one particular trait, like a physical characteristic, disease, or behavioral tendency. With that background information, I can now explain how a Mendelian randomization (MR) study works (somewhat, as I’ll admit I still don’t understand the mathematic intricacies).
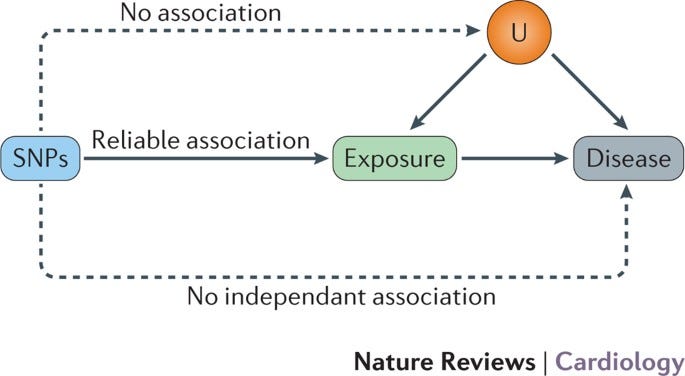
A key assumption of MR studies is that among a population of humans, mate selection is unrelated to genotype and thus genetic variants are randomly assigned at birth through the process of meiosis. This random assignment can be used to control for the confounding factors that typically plague observational studies. Thus, the power of an MR study comes from the fact that genetic variants (typically SNPs) associated with exposures of interest, but not independently associated with the outcome(s) of interest, can be used as “instrumental variables” that control for confounding factors and causally link predictors of interest to outcomes of interest (or demonstrate that there is no causal relationship).4
In the study that got me going on this long tangent about genetics research and MR studies, the “exposures” of interest are physical activity and sedentary time. The outcomes of interest are depression, anxiety, and well-being. So, to use the MR method to test the causal effect of physical activity and sedentary time on depression, anxiety, and well-being, they first had to identify SNPs associated with physical activity (PA) and sedentary time (ST) by performing a GWAS analysis.5
With these SNPs identified, the researchers were able to “genetically instrument” physical activity and sedentary time to assess how they influence depression, anxiety, and well-being. This is the multi-step part of the process that involves a lot of complicated math and I need to learn more before I could explain it better. But essentially, SNPs that are also strongly correlated with the outcomes are removed from the set of SNPs that are used as instrumental variables for the exposures (PA & ST). Then linear regressions are used to assess how well SNP exposure (i.e., the number of SNPs someone has that are correlated with the predictor variables of physical activity and sedentary time) predicts the outcome variables (depression, anxiety, and well-being scores).
At risk of spending too much time on this study, I’ll spare you most of the details, but the key findings are summarized in the following series of quotes. “A genetically instrumented 1-SD [standard deviation] higher [level of] PA was associated with 0.92 lower odds of major depression (95% CI: 0.88; 0.97)” and “with lower current depression severity (beta = − 0.11; 95% CI: − 0.18; − 0.04).” “Genetically instrumented higher ST was associated with higher odds of lifetime anxiety (OR = 2.25; 95% CI: 1.10; 4.60).” “PA was associated with higher well-being (beta = 0.11, 95% CI: 0.04; 0.18) and ST with lower well-being (beta = − 0.18; 95% CI: − 0.32, − 0.03).” “There was evidence for a bidirectional relationship, with higher genetic liability to depression associated with lower PA (beta = − 0.25, 95% CI: − 0.42; − 0.08) and higher well-being associated with higher PA (beta = 0.15; 95% CI: 0.05, 0.25).”
I realize that’s a lot of information in that last paragraph and the OR and beta values can be very confusing. As a reminder, I explain odds ratios (ORs) in wrap #8 (see here). If you understand ORs, understanding the ORs above is pretty straightforward. For example, the first result statistic in the above paragraph, “OR = 0.92; 95% CI: 0.88, 0.97” means that those who were 1 standard deviation above the average in their amount of physical activity, had about an 8% (from 1 minus 0.92) lower odds of major depression. But even if you understand beta values, which are the coefficients in linear regressions that link the level of change in a predictor to the level of change in an outcome, the results are still not straightforward and not well-explained in this paper. This is because it is very hard to keep track of the units being used for each measurement (I’ll explain this further in the next paragraph).
For example, the beta value of − 0.11 from above generally means that for a unit increase in physical activity, there’s a 0.11 unit decrease in depression severity, but without knowing the units and range of possible values of these two variables it is impossible to know how strong this effect is. The same goes for the rest of the stated beta values. This makes understanding and interpreting the results of this study quite a mess.
To make things even more complicated, this study used two different data sets for their measurements of depression, anxiety, and well-being: the main UK BioBank dataset where PA and ST information came from, and data from the Psychiatric Genomic Consortium (PGC). Many of the statistical analyses were significant for one data set but not the other.
Takeaways:
Mendelian Randomization studies are complicated af and I may have gotten a little in over my head on this one.
Physical activity can help prevent depression and increase well-being, whereas increases in sedentary time can lead to decreases in well-being.
These results are complicated by the fact that depression is associated with lower amounts of physical activity and higher well-being is associated with higher physical activity.
Sleep
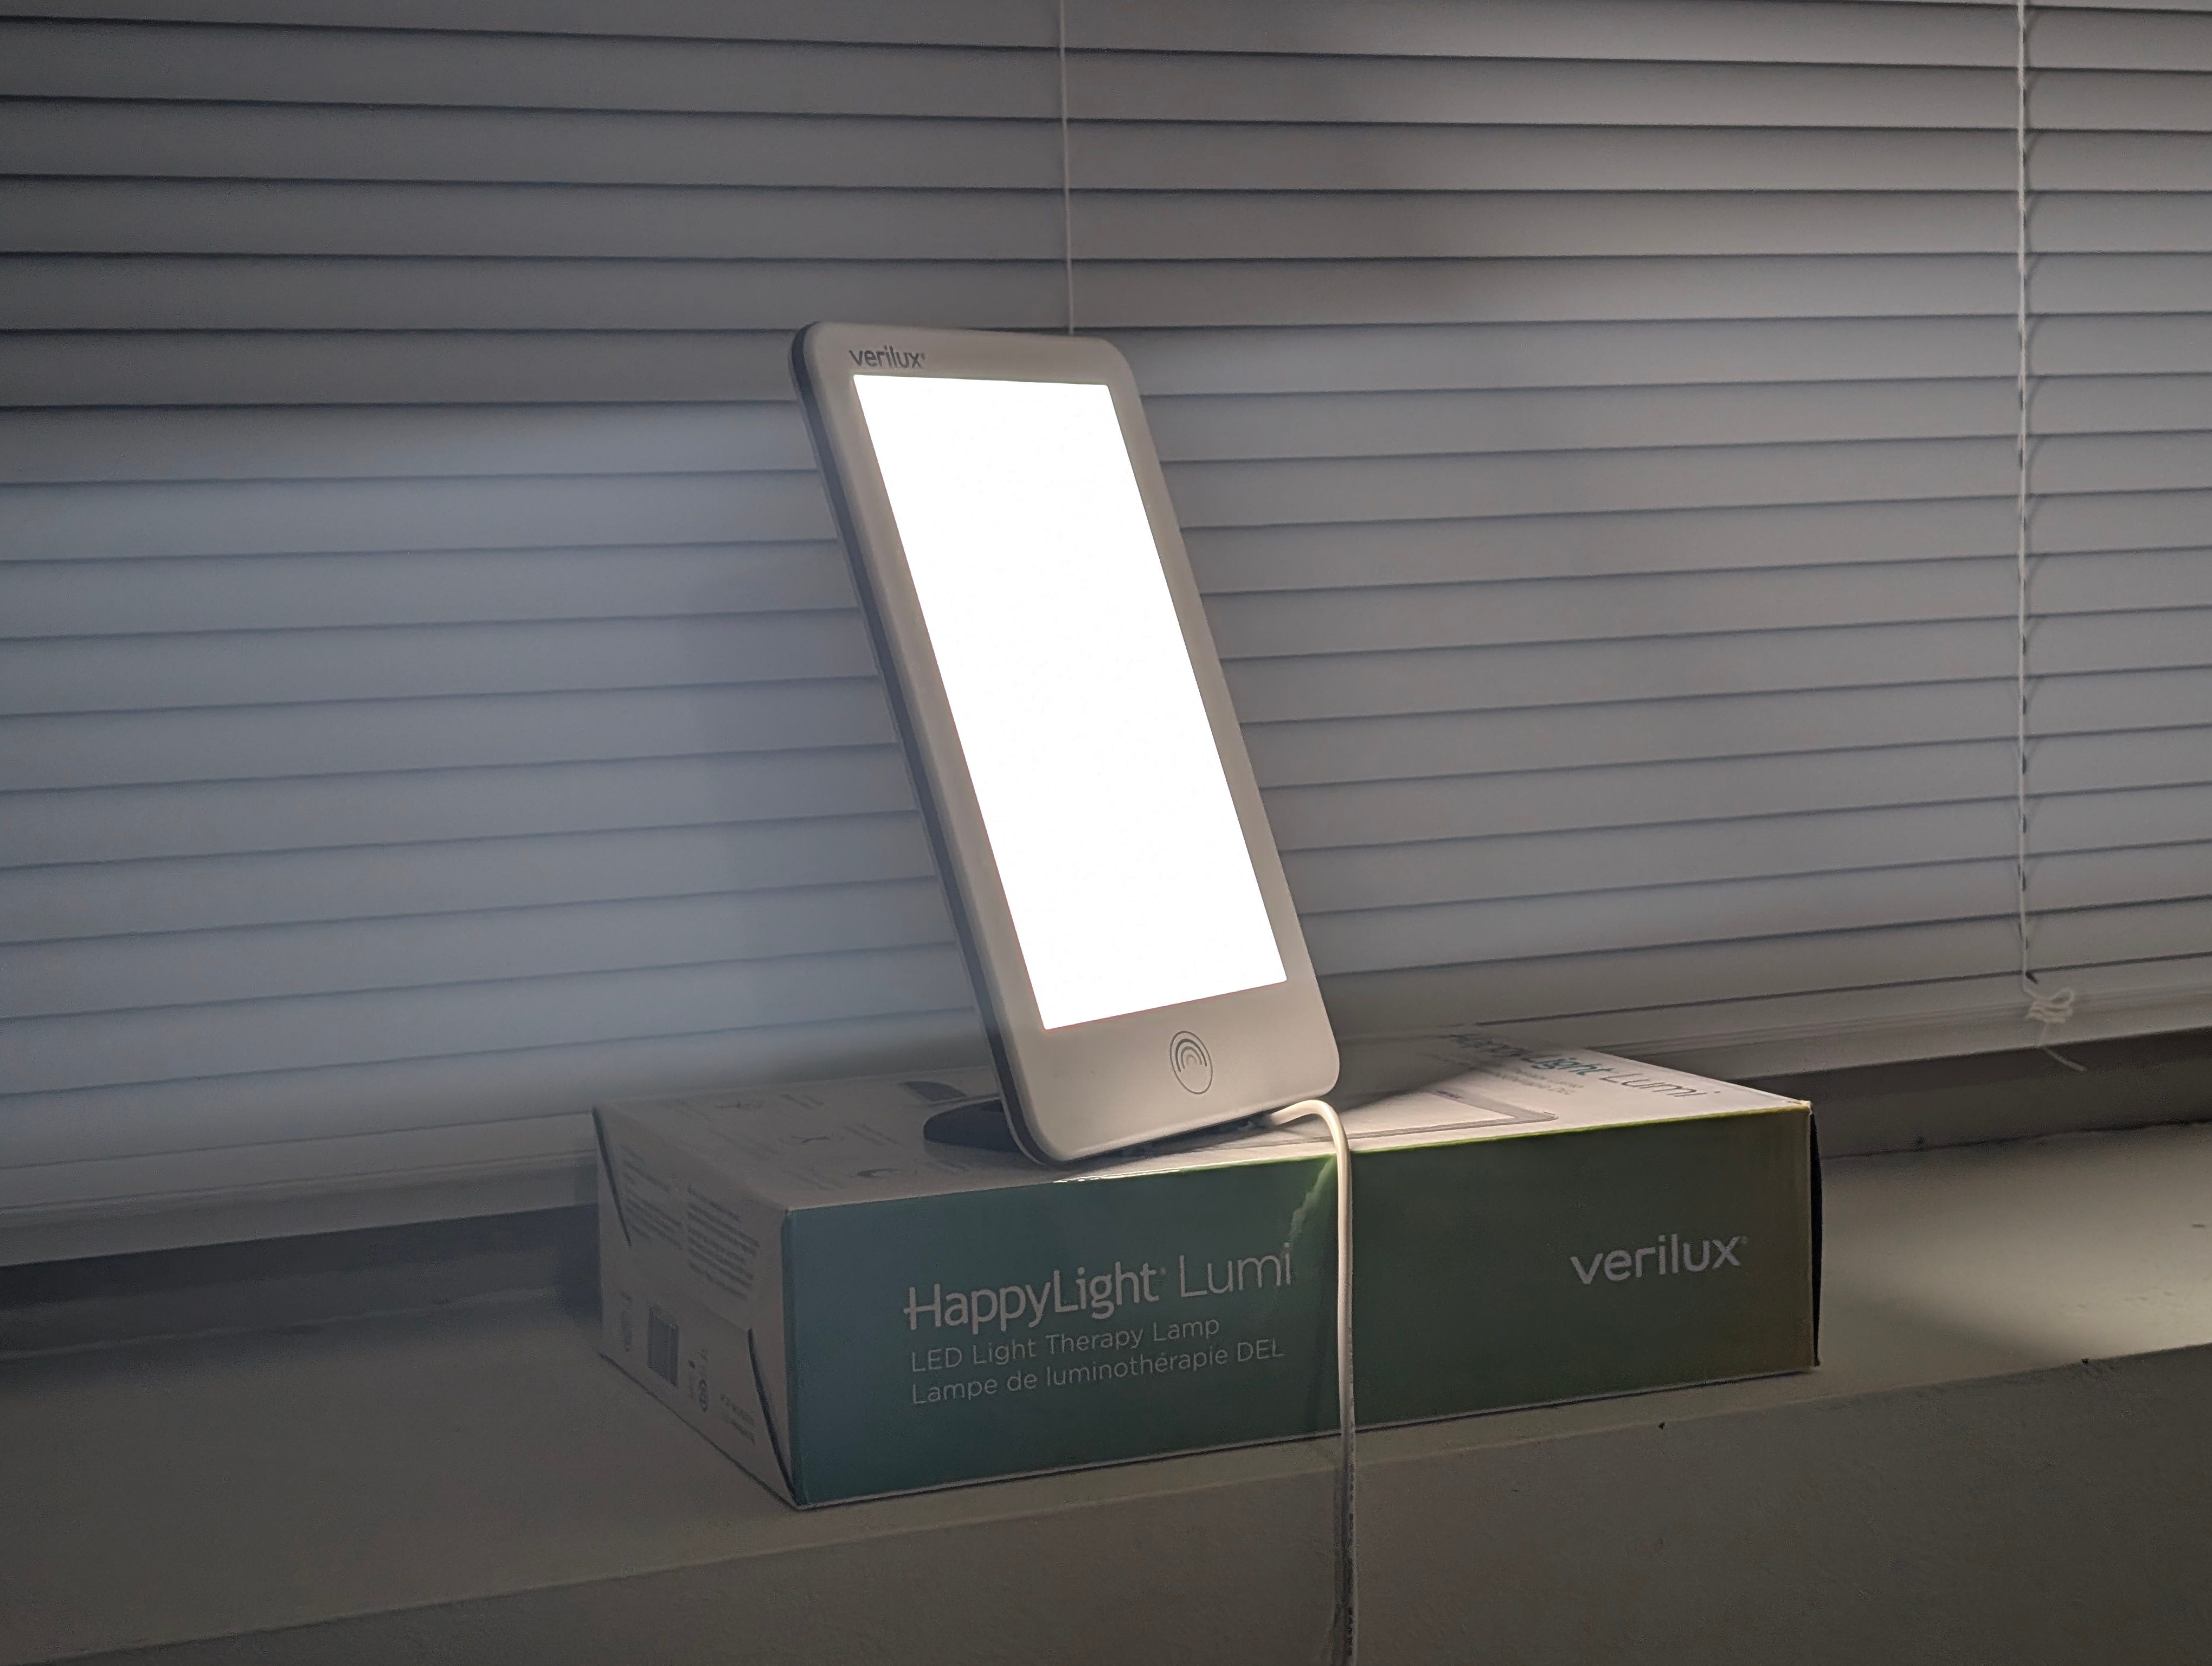
Afternoon Nap and Bright Light Exposure Improve Cognitive Flexibility Post Lunch | May 27, 2015 | N = 25 healthy adults
Randomized Controlled Trial
This study found that both a nap and exposure to bright light for 30 minutes after lunch can improve one’s ability to switch between tasks when performing work thereafter.
The small sample size limits the strength of these findings.
Stress
Efficacy of digital cognitive behavioral therapy for moderate-to-severe symptoms of generalized anxiety disorder: A randomized controlled trial | July 29, 2020 | N = 256 participants with moderate-to-severe symptoms of GAD | Randomized Controlled Trial
The Daylight app is an FDA-cleared digital therapeutic used to administer cognitive behavioral therapy (CBT) to patients with generalized anxiety disorder (GAD).
This study was instrumental in the FDA granting clearance for providers to prescribe this app to patients with GAD.
I’m not sure why this study was published 4 years ago but the app was only granted clearance last year, but I’d like to look into this further. If you look into it further yourself, let me know what you find.
Results from the abstract:
Overall, 256 participants were randomized and intention-to-treat analysis found Daylight reduced symptoms of anxiety compared with waitlist control at post-intervention, reflecting a large effect size (adjusted difference [95% CI]: 3.22 [2.14, 4.31], d = 1.08). Significant improvements were found for measures of worry; depressive symptoms, sleep difficulty, wellbeing, and participant-specific quality of life.
Connection
Social participation, loneliness, and physical inactivity over time: evidence from SHARE | January 27, 2024
N = 64,887 participants aged ≥ 50 at study beginning
Longitudinal Cohort Study
Idk… this study seemed interesting at first, but the methods are a complicated mess of statistics that I don’t even want to begin to try to understand after spending the time that I did on the Mendelian Randomization study.
If anyone reading this understands cross-lagged panel models (CLPMs) please reach out if you want to help me interpret the results of this study.
Takeaway: “These findings highlight the importance of promoting physical activity and social participation and addressing loneliness through targeted interventions in older adults.”
Other
I’ve continued to follow what Bryan Johnson is up to and last weekend I read three essays (well, part of one until I hit a paywall, and two others) criticizing him, which made me more skeptical of his work and some of the claims he espouses. I shared the following post about this in the Don’t Die app:
Most of the criticism aimed at Bryan is shallow and poorly reasoned. But if you tend to believe everything coming from Bryan & the Blueprint team, I suggest reading the following two essays:
The World’s Most Expensive Eating Disorder from the Desmolysium Blog
&
The Crap Science behind Bryan Johnson's $2M Diet by Joseph Everett(the has since made two more posts on his Substack about Bryan after this one) (the titles are inflammatory, but the critiques are valid)
My post was character-limited, so that’s all I could fit in the post. The third essay that I did not link is the one that I mentioned above, which is pay-walled; also by Joseph Everett (of What I Learned) the essay is titled The Full Bryan Johnson Story: What's the real purpose of Blueprint? You can actually read pretty far and take quite a deep dive into this before hitting the pay wall, so I’m curious how long the full thing really is. Maybe I’ll become a paid Subscriber soon.6
In summary, the above essays highlight reasons to be skeptical about some of Bryan’s claims, what information about his health he might not be sharing, and how some perverse incentives are likely influencing him; namely, the fact he’s turned his health journey into a business. For example, he’s been saying that he’s the healthiest person in the world, which might be true but it’s probably more of a marketing stunt than a truly genuine claim.

Then, a few days later, after listening to a podcast featuring Bryan (which I highly recommend) I posted the following on the app:
Really enjoying making my way through this long podcast episode featuring Bryan. Some of the best questions and discussions I've heard about Don't Die and what Bryan's mission and vision are. Plus, the production quality of this video podcast is fantastic.
After sharing a couple of articles that increased my skepticism of Bryan a few days ago, this podcast has now increased my trust in him.
This podcast is also on YouTube, see here.
All in all, I’m going to take a lot of the health claims that Bryan shares less seriously, after all, he’s not a scientist or a doctor himself. More importantly, I think the philosophy of don’t die, which he gets into in this podcast, is very fascinating and should be taken seriously by serious philosophers. I want to see if any philosophers are contemplating and writing about Zeroism and Don’t Die and what they have to say. I think Bryan is a very genuine and honest public figure, despite his fame and fortune and that’s difficult. He’s imperfect, but aren’t we all?
As always, please let me know if you notice any typos or mistakes in this post.
Disclaimer: This newsletter provides health information and research for educational purposes only. It is not a substitute for professional medical advice. Consult a healthcare professional for guidance on your health-related decisions. We are not medical professionals.
Almost all Substack articles have a play button for listening now and the voiceovers are high quality.
Nguyen, M., Jarvis, S. E., Tinajero, M. G., Yu, J., Chiavaroli, L., Mejia, S. B., Khan, T. A., Tobias, D. K., Willett, W. C., Hu, F. B., Hanley, A. J., Birken, C. S., Sievenpiper, J. L., & Malik, V. S. (2023). Sugar-sweetened beverage consumption and weight gain in children and adults: a systematic review and meta-analysis of prospective cohort studies and randomized controlled trials. The American journal of clinical nutrition, 117(1), 160–174. https://doi.org/10.1016/j.ajcnut.2022.11.008
Lara-Castor, L., O’Hearn, M., Cudhea, F. et al. Burdens of type 2 diabetes and cardiovascular disease attributable to sugar-sweetened beverages in 184 countries. Nat Med (2025). https://doi.org/10.1038/s41591-024-03345-4
Hollis, J. H., Houchins, J. A., Blumberg, J. B., & Mattes, R. D. (2009). Effects of concord grape juice on appetite, diet, body weight, lipid profile, and antioxidant status of adults. Journal of the American College of Nutrition, 28(5), 574–582. https://doi.org/10.1080/07315724.2009.10719789
I realize this is perhaps overly simplified and thus not well fully explained. I did my best to condense this complicated methodology into a succinct explanation, but this can never be done perfectly.
Physical activity and sedentary time came from activity trackers that participants in the UK Biobank study wore for 7 days.
I used to support Joseph Everett via Patreon because I learned so much from his YouTube videos in years past, but I stopped following his work so closely and decided to end my $1/month contribution to him sometime last year. I paid $5/month for a few months to see what extra information he shared on Patreon back in like 2020 or 2021.